Figure 7.3 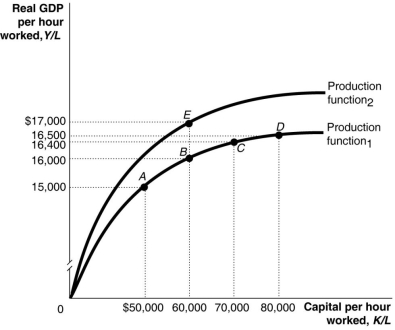 Alt text for Figure 7.3: In figure 7.3, a graph, comparing capital per hour worked and real GDP per hour worked.
Long description for Figure 7.3: The x-axis is labelled, capital per hour worked, K/L.The y-axis is labelled, real GDP per hour worked, Y/L.2 concave curves originating from 0 at the vertex are shown.5 points A ($50000, $15000) , B ($60000, $16000) , C ($70000, $16400) , D ($80000, $16500) , and E ($60000, $17000) are plotted.The curve labelled Production function 1, passes through points A, B, C, and D.The curve labelled Production function 2, passes through point E.These 5 points are connected to their respective coordinates on the x and y-axis with dotted lines.
-Refer to Figure 7.3.Which of the following would cause an economy to move from a point like A in the figure above to a point like B?
A) an improvement in technology
B) a decrease in capital per hour worked
C) an increase in capital per hour worked
D) a technological regression
E) a rise in the population
Correct Answer:
Verified
Q103: In the long run, a country will
Q104: A small economy increased its capital per
Q105: The former Soviet Union consistently increased the
Q106: Figure 7.3 Q107: The per-worker production function shows the relationship Q109: In a small Asian country, it is Q110: If there is a change in the Q111: Technological change will Q112: What is human capital? Q113: Figure 7.3 ![]()
A)shift the per-worker production function
A)labour productivity
B)buildings, equipment, and![]()
Unlock this Answer For Free Now!
View this answer and more for free by performing one of the following actions

Scan the QR code to install the App and get 2 free unlocks

Unlock quizzes for free by uploading documents