Figure 9.5 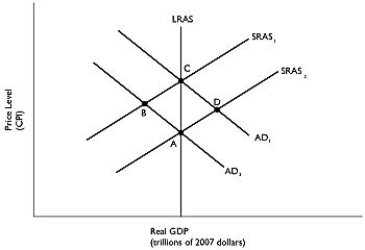 Alt text for Figure 9.5: In figure 9.5, a graph comparing real GDP and price level.
Long description for Figure 9.5: The x-axis is labelled, real GDP (trillions of 2007 dollars) , and the y-axis is labelled, price level (CPI) .5 lines are shown; SRAS1, SRAS2, AD1, AD2, and LRAS.Line SRAS1 begins above the vertex and slopes up to the top right corner.Line SRAS2 follows the same slope as line SRAS1, but is plotted to the right.Line AD1 begins at the top left corner and slopes down to the bottom center.Line AD2 follows the same slope as AD1, but is plotted to the right.Line SRAS1 intersects line AD1 at point C, more than half way along both the lines.Line SRAS1 intersects line AD2 at point B, approximately 3 quarters of the way along both lines.Line SRAS2 intersects line AD1 at point D, approximately 3 quarters of the way along both lines.Line SRAS2 intersects line AD2 at point A, more than half way along both lines.Line LRAS is perpendicular to the x-axis, passing through the points A and C, and intersecting all the 4 lines.
-Refer to Figure 9.5.Suppose the economy is at point C.If government spending decreases in the economy, where will the eventual long-run equilibrium be?
A) A
B) B
C) C
D) D
E) None of these points are long-run equilibria.
Correct Answer:
Verified
Q152: The long-run adjustment to a negative supply
Q153: Which of the following is considered a
Q154: When the aggregate demand curve and the
Q155: Figure 9.5 Q156: The automatic mechanism _ the price level Q158: _ of unemployment during _ make it Q159: Assume interest rates in the economy have![]()
Unlock this Answer For Free Now!
View this answer and more for free by performing one of the following actions

Scan the QR code to install the App and get 2 free unlocks

Unlock quizzes for free by uploading documents