Figure 9.5 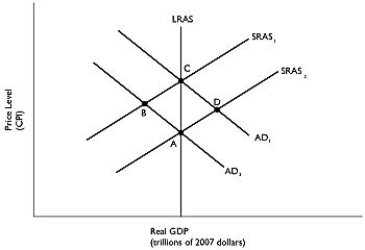 Alt text for Figure 9.5: In figure 9.5, a graph comparing real GDP and price level.
Long description for Figure 9.5: The x-axis is labelled, real GDP (trillions of 2007 dollars) , and the y-axis is labelled, price level (CPI) .5 lines are shown; SRAS1, SRAS2, AD1, AD2, and LRAS.Line SRAS1 begins above the vertex and slopes up to the top right corner.Line SRAS2 follows the same slope as line SRAS1, but is plotted to the right.Line AD1 begins at the top left corner and slopes down to the bottom center.Line AD2 follows the same slope as AD1, but is plotted to the right.Line SRAS1 intersects line AD1 at point C, more than half way along both the lines.Line SRAS1 intersects line AD2 at point B, approximately 3 quarters of the way along both lines.Line SRAS2 intersects line AD1 at point D, approximately 3 quarters of the way along both lines.Line SRAS2 intersects line AD2 at point A, more than half way along both lines.Line LRAS is perpendicular to the x-axis, passing through the points A and C, and intersecting all the 4 lines.
-Refer to Figure 9.5.Suppose the economy is at point A.If the economy experiences a supply shock, where will the eventual short-run equilibrium be?
A) A
B) B
C) C
D) D
E) None of these points are consistent with a short-run equilibrium following a supply shock.
Correct Answer:
Verified
Q138: During the winter of 2015, incredible snowfall
Q140: Long-run macroeconomic equilibrium occurs when
A)aggregate demand equals
Q141: A decrease in aggregate demand in the
Q142: Suppose the economy is at a short-run
Q144: Why does the short-run aggregate supply curve
Unlock this Answer For Free Now!
View this answer and more for free by performing one of the following actions

Scan the QR code to install the App and get 2 free unlocks

Unlock quizzes for free by uploading documents