Figure 11.1 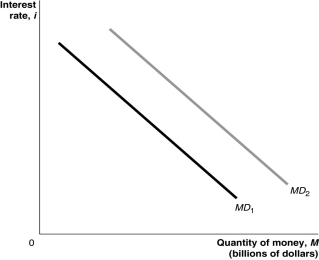 Alt text for Figure 11.1: In figure 11.1, a graph shows shift in the money demand curve.
Long description for Figure 11.1: The x-axis is labelled, quantity of money, M (billions of dollars) .The y-axis is labelled, interest rate, i.2 lines are shown; MD1 and MD2.Line MD1 begins in the top left corner and slopes down to the end of the x-axis.Line MD2 follows the same slope as line MD1, but is plotted to the right.
-Refer to Figure 11.1.In the figure, the money demand curve would move from MD1 to MD2 if
A) real GDP increased.
B) the price level decreased.
C) the interest rate increased.
D) the Bank of Canada sold government of Canada securities.
E) population fell.
Correct Answer:
Verified
Q24: The money demand curve has a
A)negative slope
Q25: Which of the following will lead to
Q26: Maintaining a strong dollar in international currency
Q27: When the Bank of Canada decreases the
Q28: An increase in the demand for government
Q30: Using the money demand and money supply
Q31: An increase in the interest rate causes
A)a
Q32: An increase in the interest rate
A)decreases the
Q33: Suppose that households became mistrustful of the
Q34: When the Bank of Canada increases the
Unlock this Answer For Free Now!
View this answer and more for free by performing one of the following actions

Scan the QR code to install the App and get 2 free unlocks

Unlock quizzes for free by uploading documents