Figure 11.3 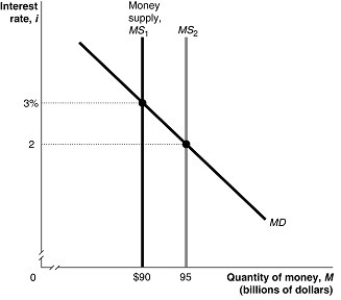 Alt text for Figure 11.3: In figure 11.3, a graph shows shift in money supply.
Long description for Figure 11.3: The x-axis is labelled, quantity of money, M (billions of dollars) , with values $90 and 95 marked.The y-axis is labelled, interest rate, i, with values 2 and 3% marked.3 lines are shown; MS1, MS2, and MD.Line MD begins in the top left corner and slopes down to the end of the x-axis.Line Money, supply MS1, is perpendicular to the x-axis, and begins from the value $90.Line MS2 is perpendicular to the x-axis, and begins from the value 95, to the right of line MS1.Line MD meets line MS1 at point ($90, 3%) , approximately 3 quarters of the way along both lines.Line MD meets line MS2 at point (95, 2) , almost half way along both lines.These points of intersection are connected to their respective coordinates on the y-axis using dotted lines.
-Refer to Figure 11.3.In the figure above, when the money supply shifts from MS1 to MS2, at the interest rate of 3 percent households and firms will
A) buy Canada bonds.
B) sell Canada bonds.
C) neither buy nor sell Canada bonds.
D) want to hold more money.
E) increase their savings.
Correct Answer:
Verified
Q40: Using the money demand and money supply
Q41: If the Bank of Canada raises the
Q42: Use the money demand and money supply
Q44: For purposes of monetary policy, the Bank
Q46: A monetary policy target is a variable
Q47: A monetary policy target is a variable
Q49: The Bank of Canada can simultaneously reduce
Unlock this Answer For Free Now!
View this answer and more for free by performing one of the following actions

Scan the QR code to install the App and get 2 free unlocks

Unlock quizzes for free by uploading documents