Figure 11.4 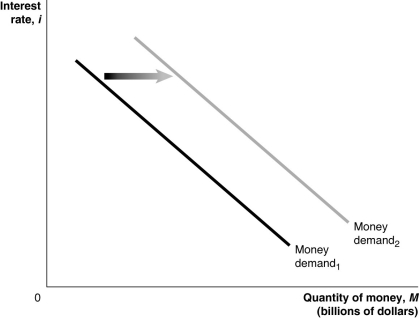 Alt text for Figure 11.4: In figure 11.4, a graph shows shift in money demand curve.
Long description for 11.4: The x-axis is labelled, quantity of money, M (billions of dollars) .The y-axis is labelled, interest rate, i.2 lines are shown; Money demand 1 and Money demand 2.Line Money, demand 1, begins in the top left corner and slopes down to the end of the x-axis.Line Money, demand 2, follows the same slope as line Money, demand 1, but is plotted to the right.The area between the lines Money, demand 1, and Money, demand 2, is indicated by a right pointing arrow.
-Refer to Figure 11.4.In the figure above, the money demand curve would move from Money demand1 to Money demand2 if
A) real GDP decreased.
B) the price level increased.
C) the interest rate increased.
D) the Bank of Canada sold government securities.
E) households expected lower incomes in the future.
Correct Answer:
Verified
Q60: The money demand curve, against possible levels
Q61: A decrease in real GDP can
A)shift money
Q62: The money market model is concerned with
Q63: Increases in the price level
A)increase the opportunity
Q64: Suppose the Bank of Canada decreases the
Q66: Buying a house during a recession may
Q67: Suppose the Bank of Canada increases the
Q68: Which of the following correctly describes a
Q69: The money supply curve is vertical if
A)banks
Q70: The rate of interest banks charge other
Unlock this Answer For Free Now!
View this answer and more for free by performing one of the following actions

Scan the QR code to install the App and get 2 free unlocks

Unlock quizzes for free by uploading documents