Figure 11.5 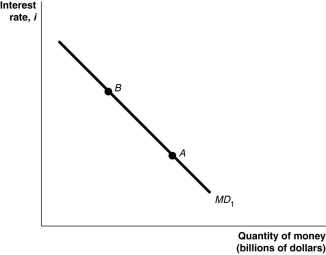 Alt text for Figure 11.5: In figure 11.5, a graph shows movement in money demand curve.
Long description for Figure 11.5: The x-axis is labelled, quantity of money, M (billions of dollars) .The y-axis is labelled, interest rate, i.Line MD1 begins in the top left corner and slopes down to the bottom center.Points A and B are marked along line MD1.Point A is close to the bottom of the line, and point B is close to the top of the line.
-Refer to Figure 11.5.In the figure above, a movement from point A to point B would be caused by
A) a decrease in real GDP.
B) an increase in the price level.
C) a decrease in the price level.
D) an increase in the interest rate.
E) a decrease in the interest rate.
Correct Answer:
Verified
Q50: When the price of a financial asset
Q67: Suppose the Bank of Canada increases the
Q68: Which of the following correctly describes a
Q69: The money supply curve is vertical if
A)banks
Q70: The rate of interest banks charge other
Q74: If the Bank of Canada buys Canada
Q75: The overnight interest rate
A)is determined administratively by
Q76: An increase in the money supply will
A)increase
Q77: An increase in real GDP
A)increases the buying
Q92: Ceteris paribus,an increase in the money supply
Unlock this Answer For Free Now!
View this answer and more for free by performing one of the following actions

Scan the QR code to install the App and get 2 free unlocks

Unlock quizzes for free by uploading documents