Figure 11.6 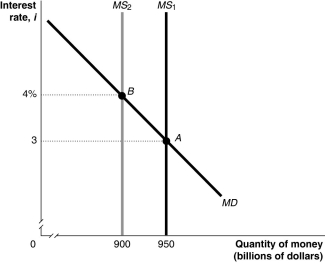 Alt text for Figure 11.6: In figure 11.6, a graph shows movement in the money market.
Long description for Figure 11.6: The x-axis is labelled, quantity of money, M (billions of dollars) , with values 900 and 950 marked.The y-axis is labelled, interest rate, i, with values 3 and 4% marked.3 lines are shown; MS1, MS2, and MD.Line MD begins in the top left corner and slopes down to the end of the x-axis.Line MS1 is perpendicular to the x-axis, and begins from the value 950.Line MS2 is perpendicular to the x-axis, and begins from the value 900, to the left of line MS1.Line MD intersects line MS1 at point A (950, 3) , approximately 3 quarters of the way along both lines.Line MD meets line MS2 at point B (900, 4%) , more than half way along both lines.These points of intersection are connected to their respective coordinates on the y-axis using dotted lines.
-Refer to Figure 11.6.In the figure above, the movement from point A to point B in the money market would be caused by
A) an increase in the price level.
B) a decrease in real GDP.
C) an open market sale of Canada bonds by the Bank of Canada.
D) a decrease in the desired reserve ratio by commercial banks.
E) an increase in the willingness of commercial banks to make risky loans.
Correct Answer:
Verified
Q74: If the Bank of Canada buys Canada
Q75: The overnight interest rate
A)is determined administratively by
Q76: An increase in the money supply will
A)increase
Q77: An increase in real GDP
A)increases the buying
Q78: Figure 11.7 Q80: The overnight interest rate is Q81: From an initial long-run macroeconomic equilibrium, if Q82: Figure 11.9 Q83: By May 2009, bank reserves in the Q84: Figure 11.9 Unlock this Answer For Free Now! View this answer and more for free by performing one of the following actions Scan the QR code to install the App and get 2 free unlocks Unlock quizzes for free by uploading documents![]()
A)the interest rate![]()
![]()

