Figure 11.8 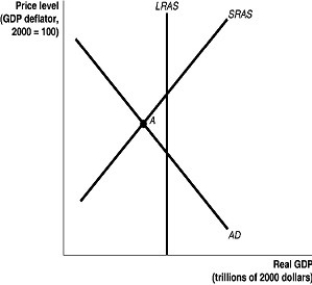 Alt text for Figure 11.8: In figure 11.8, a graph comparing real GDP and price level.
Long description for Figure 11.8: The x-axis is labelled, real GDP (trillions of 2000 dollars) , and the y-axis is labelled, price level (GDP deflator, 2000 = 100) .3 lines are shown; AD, LRAS, SRAS.Line AD begins in the top left corner and slopes down to the bottom center.Line SRAS begins in the bottom left corner and slopes up to the top right corner.Line LRAS is perpendicular to the x-axis, and intersects the lines AD and SRAS.The point of intersection of the lines AD and SRAS is marked as A.
-Refer to Figure 11.8.In the figure above, if the economy is at point A, the appropriate monetary policy by the Bank of Canada would be to
A) lower interest rates.
B) raise interest rates.
C) lower income taxes.
D) raise income taxes.
E) increase spending.
Correct Answer:
Verified
Q90: Rising nominal GDP will increase the demand
Q95: Figure 11.9 Q96: Figure 11.9 Q98: Buying a house during a recession may Q99: Use the money demand and money supply Q101: If money demand is extremely sensitive to Q102: When the Bank of Canada uses contractionary Q103: What actions should the Bank of Canada Q104: If the Bank of Canada orders a Q105: Which of the following is true about![]()
![]()
Unlock this Answer For Free Now!
View this answer and more for free by performing one of the following actions

Scan the QR code to install the App and get 2 free unlocks

Unlock quizzes for free by uploading documents