Figure 11.9 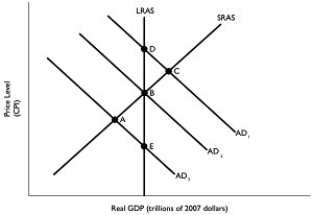 Alt text for Figure 11.9: In figure 11.9, a static AD-AS model.
Long description for Figure 11.9: The x-axis is labelled, real GDP (trillions of 2007 dollars) and the y-axis is labelled, price level (CPI) .5 lines are shown; AD1, AD2, AD3, LRAS, SRAS.Line AD1 begins in the top left corner and slopes down to the end of the x-axis.Line AD2 follows the same slope but is plotted to the left.Similarly, line AD3 is plotted to the left of line AD2.Line SRAS begins close to the vertex and slopes up to the top right corner.Line LRAS is perpendicular to the x-axis, and passes through points D, B, and E.Lines AD3 and SRAS intersect at point A.Lines AD2, LRAS, and SRAS intersect at point B.Lines AD1 and SRAS intersect at point C.Lines AD1 and LRAS intersect at point D.Lines AD3 and LRAS intersect at point E.
-Refer to Figure 11.9.Suppose the economy is in a recession and the Bank of Canada pursues an expansionary monetary policy.Using the static AD-AS model in the figure above, this would be depicted as a movement from
A) A to B.
B) B to C.
C) C to B.
D) A to E.
E) C to D.
Correct Answer:
Verified
Q82: An increase in the interest rate should
Q88: Give an example of a monetary policy
Q89: The situation in which short-term interest rates
Q90: An increase in interest rates
A)decreases investment spending
Q90: Rising nominal GDP will increase the demand
Q92: The ability of the Bank of Canada
Q94: Expansionary monetary policy refers to the _
Unlock this Answer For Free Now!
View this answer and more for free by performing one of the following actions

Scan the QR code to install the App and get 2 free unlocks

Unlock quizzes for free by uploading documents