Figure 11.10 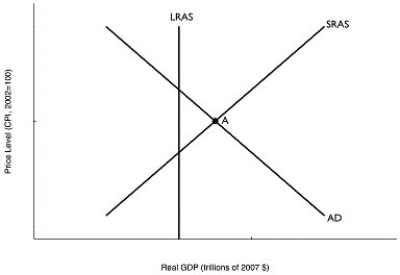 Alt text for Figure 11.10: In figure 11.10, a graph comparing real GDP and price level.
Long description for Figure 11.10: The x-axis is labelled, real GDP (trillions of 2007 dollars) and the y-axis is labelled, price level (CPI, 2002 = 100) .3 lines are shown; AD, LRAS, SRAS.Line AD begins in the top left corner and slopes down to the end of the x-axis.Line SRAS begins in the bottom left corner and slopes up to the top right corner.Line LRAS is perpendicular to the x-axis, and intersects the lines AD and SRAS.The point of intersection of lines AD and SRAS is marked as A.
-Refer to Figure 11.10.In the figure above, if the economy is at point A, the appropriate monetary policy by the Bank of Canada would be to
A) lower the target for the overnight interest rate.
B) raise the target for the overnight interest rate.
C) lower income taxes.
D) raise income taxes.
E) lower the desired reserve ratio.
Correct Answer:
Verified
Q131: Figure 11.11 Q132: In which of the following situations would Q133: Which of the following situations is one Q134: The Bank of Canada![]()
A)always engages in countercyclical
Unlock this Answer For Free Now!
View this answer and more for free by performing one of the following actions

Scan the QR code to install the App and get 2 free unlocks

Unlock quizzes for free by uploading documents