Figure 11.11 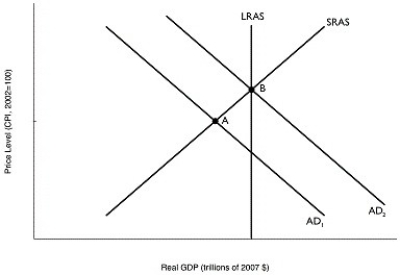 Alt text for Figure 11.11: In figure 11.11, a graph comparing real GDP and price level.
Long description for Figure 11.11: The x-axis is labelled, real GDP (trillions of 2007 dollars) and the y-axis is labelled, price level (CPI, 2002 = 100) .4 lines are shown; AD1, AD2, LRAS, SRAS.Line AD1 begins in the top left corner and slopes down to the end of the x-axis.Line AD2 follows the same slope but is plotted to the right.Line SRAS begins in the bottom left corner and slopes up to the top right corner.Line LRAS is perpendicular to the x-axis, and intersects lines AD2 and SRAS at point B.Lines AD1 and SRAS intersect at point A.
-Refer to Figure 11.11.In the figure above, suppose the economy is initially at point A.The movement of the economy to point B as shown in the graph illustrates the effect of which of the following policy actions by the Bank of Canada?
A) a decrease in income taxes
B) an increase in the desired reserve ratio
C) an open market purchase of Canada bonds
D) an open market sale of Canada bonds
E) an increase in lending to commercial banks
Correct Answer:
Verified
Q126: If the Bank of Canada pursues expansionary
Q127: If the Bank of Canada raises its
Q128: The body that is responsible for dating
Q129: Suppose that the economy is producing above
Q130: Contractionary monetary policy causes
A)aggregate demand to rise
Q132: In which of the following situations would
Q133: Which of the following situations is one
Q134: The Bank of Canada
A)always engages in countercyclical
Q135: Figure 11.12 Q136: Figure 11.10 ![]()
![]()
Unlock this Answer For Free Now!
View this answer and more for free by performing one of the following actions

Scan the QR code to install the App and get 2 free unlocks

Unlock quizzes for free by uploading documents