Figure 11.14 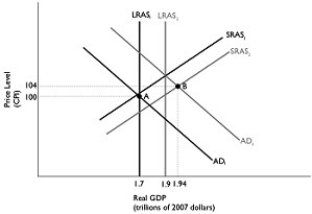 Alt text for Figure 11.14: In figure 11.14, a dynamic AD-AS model.
Long description for Figure 11.14: The x-axis is labelled, real GDP (trillions of 2007 dollars) .The y-axis is labelled, price level (CPI) .6 lines are shown; SRAS1, SRAS2, AD1, AD2, LRAS1, and LRAS2.Line SRAS1 begins near the bottom left corner and slopes up to the top right corner.Line SRAS2 follows the same slope as line SRAS1, but is plotted to the right.Line AD1 begins at the top left corner and slopes down to the end of the x-axis.Line AD2 follows the same slope as line AD1, but is plotted to the right.Line LRAS1 is perpendicular to the x-axis and begins from x-axis value 1.7.Line LRAS2 is perpendicular to the x-axis and begins from x-axis value 1.9.Line LRAS1 intersects lines AD1 and SRAS1 at point A (1.7, 100) .Lines AD2 and SRAS2 intersect at point B (1.94, 104) .Points A and B are connected to their respective coordinates on the x-axis and y-axis with dotted lines.Line LRAS1 intersects line SRAS2 below point A.Line LRAS2 intersects lines SRAS1 and AD2 just above point B.
-Refer to Figure 11.14.In the dynamic AD-AS model, if the economy is at point A in year 1 and is expected to go to point B in year 2, and the Bank of Canada pursues no policy, then at point B
A) firms are producing above capacity.
B) there is pressure on wages and prices to fall.
C) the unemployment rate is greater than the natural rate of unemployment.
D) incomes and profits are falling.
E) inventories will likely be rising.
Correct Answer:
Verified
Q152: Figure 11.13 Q153: Table 11.1 Q154: Your income will increase if the Bank Q155: What actions should the Bank of Canada Q156: Contractionary monetary policy refers to the Bank Q159: Figure 11.13 Q161: The Bank of Canada can use expansionary Unlock this Answer For Free Now! View this answer and more for free by performing one of the following actions Scan the QR code to install the App and get 2 free unlocks Unlock quizzes for free by uploading documents![]()
![]()
![]()

