Figure 12.1 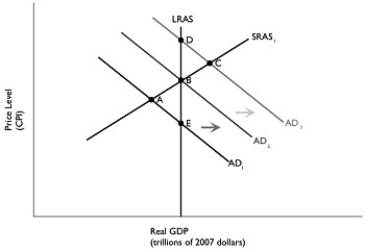 Alt text for Figure 12.1: In figure 12.1, a graph comparing real GDP and price level.
Long description for Figure 12.1: The x-axis is labelled, real GDP (trillions of 2007 dollars) and the y-axis is labelled, price level (CPI) .5 lines are shown; AD1, AD2, AD3, LRAS, and SRAS1.Line AD1 begins in the top left corner and slopes down to the end of the x-axis.Line AD2 follows the same slope, but is plotted to the right.Similarly, line AD3 also has the same slope and is plotted to the right of AD2.Line SRAS1 begins close to the vertex and slopes up to the top right corner.Line LRAS is perpendicular to the x-axis, passing through points D, B, and E.Lines AD1 and SRAS1 intersect at point A.Lines AD2, LRAS, and SRAS1 intersect at point B.Lines AD3 and SRAS1 intersect at point C.Lines AD1 and LRAS intersect at point E.Lines AD3 and LRAS intersect at point D.The area between lines AD1 and AD2 is indicated by a right pointing arrow.The area between lines AD2 and AD3 is indicated by a right pointing arrow.
-Refer to Figure 12.1.Suppose the economy is in a recession and expansionary fiscal policy is pursued.Using the static AD-AS model in the figure above, this would be depicted as a movement from
A) A to B.
B) B to C.
C) C to B.
D) B to A.
E) A to E.
Correct Answer:
Verified
Q43: Figure 12.1 Q44: Parliament carries out fiscal policy through changes Q45: Which of the following is considered contractionary![]()

