Figure 12.2 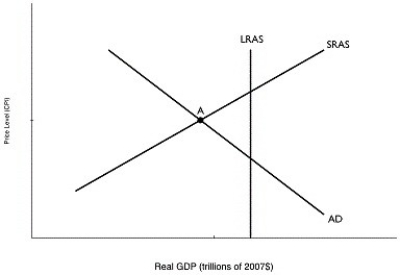 Alt text for Figure 12.2: In figure 12.2, a graph comparing real GDP and price level.
Long description for Figure 12.2: The x-axis is labelled, real GDP (trillions of 2007 dollars) and the y-axis is labelled, price level (CPI) .3 lines are shown; AD, LRAS, and SRAS.Line AD begins at the top left corner and slopes down to the end of the x-axis.Line SRAS begins near the bottom left corner and slopes up to the top right corner.Line LRAS is perpendicular to the x-axis, and intersects lines AD and SRAS at point A.
-Refer to Figure 12.2.In the graph above, if the economy is at point A, an appropriate fiscal policy by the federal government would be to
A) lower the discount rate of interest.
B) execute an open market sale of government securities.
C) increase government transfer payments.
D) increase marginal income tax rates.
E) decrease government spending.
Correct Answer:
Verified
Q66: Contractionary fiscal policy to prevent real GDP
Q69: Expansionary fiscal policy will
A)shift the aggregate demand
Q71: Figure 12.2 Q73: Which of the following is an appropriate Q74: A decrease in individual income taxes _ Q78: To combat a recession with discretionary fiscal![]()
Unlock this Answer For Free Now!
View this answer and more for free by performing one of the following actions

Scan the QR code to install the App and get 2 free unlocks

Unlock quizzes for free by uploading documents