Figure 12.5 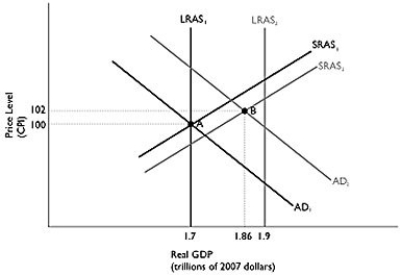 Alt text for Figure 12.5: In figure 12.5, a dynamic model of AD-AS.
Long description for Figure 12.5: The x-axis is labelled, real GDP (trillions of 2007 dollars) .The y-axis is labelled, price level (CPI) .6 lines are shown; SRAS1, SRAS2, AD1, AD2, LRAS1, and LRAS2.Line SRAS1 begins in the bottom left corner and slopes up to the top right corner.Line SRAS2 follows the same slope as line SRAS1, but is plotted to the right.Line AD1 begins at the top left corner and slopes down to the bottom center.Line AD2 follows the same slope as line AD1, but is plotted to the right.Line LRAS1 is perpendicular to the x-axis, and begins from the x-axis value 1.7.Line LRAS2 is perpendicular to the x-axis, and begins from x-axis value 1.9.Line LRAS1 intersects lines AD1 and SRAS1 at point A (1.7, 100) .Lines AD2 and SRAS2 intersect at point B (1.86, 102) .Points A and B are connected to their respective coordinates on the x and y-axes with dotted lines.Line LRAS2 intersects the lines SRAS1 and SRAS2 near the top end of these lines.Line LRAS2 intersects the lines AD1 and AD2 near the bottom end of these lines.
-Refer to Figure 12.5.In the dynamic model of AD-AS in the figure above, if the economy is at point A in year 1 and is expected to go to point B in year 2, the federal government would most likely
A) decrease government spending.
B) increase government spending.
C) increase oil prices.
D) increase taxes.
E) lower interest rates.
Correct Answer:
Verified
Q82: Figure 12.6 Q82: An increase in government spending increases the Q83: Which of the following would be most Q84: Figure 12.6 Q85: If real GDP exceeded potential real GDP Unlock this Answer For Free Now! View this answer and more for free by performing one of the following actions Scan the QR code to install the App and get 2 free unlocks Unlock quizzes for free by uploading documents![]()
![]()

