Figure 12.9 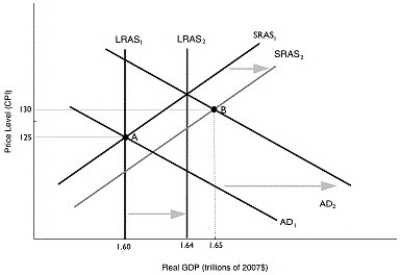 Alt text for Figure 12.9: In figure 12.9, a graph comparing real GDP and price level.
Long description for Figure 12.9: The x-axis is labelled, real GDP (trillions of 2007 dollars) .The y-axis is labelled, price level.6 lines are shown; SRAS1, SRAS2, AD1, AD2, LRAS1, and LRAS2.Line SRAS1 begins in the bottom left corner and slopes up to the top right corner.Line SRAS2 follows the same slope as line SRAS1, but is plotted to the right.The area between lines SRAS1 and SRAS2 is indicated by a right pointing arrow.Line AD1 begins at the top left corner and slopes down toward the bottom center.Line AD2 follows the same slope as line AD1, but is plotted to the right.The area between lines AD1 and AD2 is indicated by a right pointing arrow.Line LRAS1 is perpendicular to the x-axis, ad begins from the x-axis value 1.60.Line LRAS2 is perpendicular to the x-axis, and begins from the x-axis value 1.64.The area between lines LRAS1 and LRAS2 is indicated by a right pointing arrow.Line LRAS1 intersects the lines AD1 and SRAS1 at point A (1.60, 125) .Lines AD2 and SRAS2 intersect at point B (1.65, 130) .Points A and B are connected to their respective coordinates on the x and y-axes with dotted lines.
-Refer to Figure 12.9.Given that the economy has moved from A to B in the graph above, which of the following would be the appropriate fiscal policy to achieve potential GDP?
A) increase taxes
B) increase government spending
C) decrease the money supply
D) increase interest rates
E) increase transfers people
Correct Answer:
Verified
Q97: Figure 12.5 Q99: Which of the following would be most Q99: Expansionary fiscal policy is used to increase Q100: Figure 12.5 Q101: Figure 12.10 Q103: Figure 12.8 Q104: Table 12.2 Q105: Use the dynamic aggregate demand and aggregate Q107: Table 12.5 Q109: Expansionary fiscal policy _ the price level Unlock this Answer For Free Now! View this answer and more for free by performing one of the following actions Scan the QR code to install the App and get 2 free unlocks Unlock quizzes for free by uploading documents![]()
![]()
![]()
![]()
![]()
![]()

