Figure 12.11 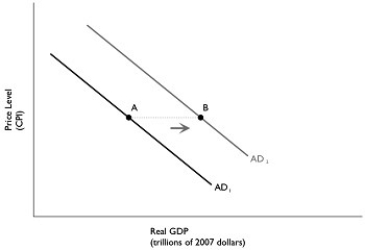 Alt text for Figure 12.11: In figure 12.11, a graph depicting the total change in aggregate demand.
Long description for Figure 12.11: The x-axis is labelled, real GDP (trillions of 2007 dollars) , and the y-axis is labelled, price level (CPI) .2 lines are shown; AD1 and AD2.Line AD1 begins at the top left corner and slopes down to the bottom center.Line AD2 follows the same slope as line AD1, but is plotted to the right.Point A is plotted half way along line AD1.Point B is plotted approximately 3 quarters of the way along line AD2.Points A and B are connected with a dotted line, and the area between them is indicated by a right pointing arrow.
-Refer to Figure 12.11.In the graph above, the shift from AD1 to AD2 represents the total change in aggregate demand.If government purchases increased by $50 billion, then the distance from point A to point B ________ $50 billion.
A) would be equal to
B) would be greater than
C) would be less than
D) may be greater than or less than
Correct Answer:
Verified
Q132: Which of the following would increase the
Q133: A change in consumption spending caused by
Q134: The tax multiplier is smaller in absolute
Q135: Suppose the federal government increased spending by
Q136: The aggregate demand curve will shift to
Q138: If the tax multiplier is -1.5 and
Q139: Suppose the government spending multiplier is 2.The
Q140: Suppose real GDP is $1.4 trillion and
Q141: The government purchases multiplier is defined as
A)
Q147: If government increases taxes by the same
Unlock this Answer For Free Now!
View this answer and more for free by performing one of the following actions

Scan the QR code to install the App and get 2 free unlocks

Unlock quizzes for free by uploading documents