Figure 13.2 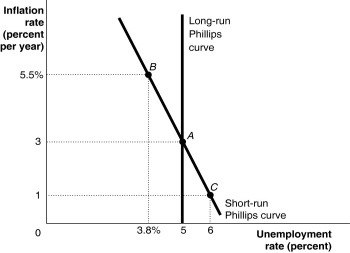 Alt text for Figure 13.2: In figure 13.2, a graph shows the short-run and long-run Phillips curves.
Long description for Figure 13.2: The x-axis is labelled, unemployment rate (percent) .The y-axis is labelled, inflation rate (percent per year) .3 points; A (5, 3) , B (3.8%, 5.5%) , C (6, 1) are plotted on the graph.The points are connected to their respective coordinates on the x and y-axes with dotted lines.A straight line labelled, short-run Philips Curve, begins at the top left corner and slopes down to the bottom center, and passes through points A, B, and C.A straight line labelled, long-run Philips Curve, is perpendicular to the x-axis, begins from the x-axis value 5,and intersects the Short-run Philips Curve at point A.
-Refer to Figure 13.2.Suppose the economy is at point C in the figure above.If workers adjust their expectations of inflation, which of the following will be true?
A) The short-run Phillips curve will shift to the right.
B) The short-run Phillips curve will shift to the left.
C) The economy will move from C to A.
D) Workers and firms expect inflation to be 1%.
E) The natural rate of unemployment is 6%.
Correct Answer:
Verified
Q60: If actual inflation is greater than expected
Q63: If the unemployment rate in the economy
Q68: What action should the Bank of Canada
Q69: Robert Shiller posed the following question to

