Figure 13.2 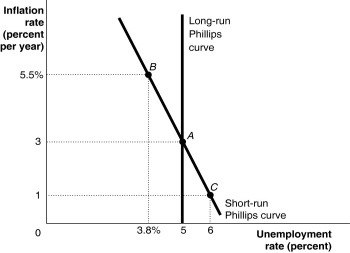 Alt text for Figure 13.2: In figure 13.2, a graph shows the short-run and long-run Phillips curves.
Long description for Figure 13.2: The x-axis is labelled, unemployment rate (percent) .The y-axis is labelled, inflation rate (percent per year) .3 points; A (5, 3) , B (3.8%, 5.5%) , C (6, 1) are plotted on the graph.The points are connected to their respective coordinates on the x and y-axes with dotted lines.A straight line labelled, short-run Philips Curve, begins at the top left corner and slopes down to the bottom center, and passes through points A, B, and C.A straight line labelled, long-run Philips Curve, is perpendicular to the x-axis, begins from the x-axis value 5,and intersects the Short-run Philips Curve at point A.
-Refer to Figure 13.2.At which point are inflation expectations equal to the actual inflation rate?
A) A
B) B
C) C
D) all of the above
Correct Answer:
Verified
Q95: Figure 13.2 Q96: Figure 13.2 Q97: If weak aggregate demand is pushing the Q98: In the long run, the Bank of Q99: If the Bank of Canada attempts to Q101: The natural rate of unemployment will not Q103: In the 1960s, many economists and policy Q105: If workers and firms raise their inflation Q118: An increase in frictional unemployment will Q127: A decrease in the level of cyclical![]()
![]()
A)shift the
Unlock this Answer For Free Now!
View this answer and more for free by performing one of the following actions

Scan the QR code to install the App and get 2 free unlocks

Unlock quizzes for free by uploading documents