Figure 13.8 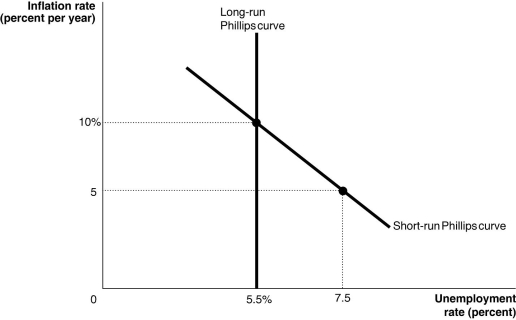 Alt text for Figure 13.8: In figure 13.8, a graph shows the short-run and long-run Phillips curves.
Long description for Figure 13.8: The x-axis is labelled, unemployment rate percent.The y-axis is labelled, inflation rate percent per year.A line labelled, short-run Philips Curve, begins at the top left corner and slopes down to the end of the x-axis.A line labelled, long-run Philips Curve, is perpendicular to the x-axis, and begins fro the x-axis value 5.5%.Lon-run Philips Curve intersects short-run Philips Curve, at point (5.5%, 10%) just past the midpoints of both lines.Point (7.5, 5) is plotted close to the right end of the short-run Philips Curve.The points are connected to their respective coordinates on the x and y-axes with dotted lines.
-Refer to Figure 13.8.Consider the Phillips curves depicted in the graph above.The Bank of Canada announces its intention to decrease inflation from 10 percent to 5 percent per year, and it succeeds. If expectations of inflation are reduced to 8 percent by the Bank of Canada's announcement, the rate of unemployment will be ________ in the short run.
A) less than 5.5 percent
B) 5.5 percent
C) between 5.5 and 7.5 percent
D) 7.5 percent
Correct Answer:
Verified
Q184: Real business cycle models argue that fluctuations
Q191: The "rational expectations" school of economists,including Robert
Q195: What impact does expansionary monetary policy have
Q197: If people assume that future rates of
Q198: If the public holds rational expectations regarding
Q201: Figure 13.11 Q202: A reduction in the rate of inflation Q203: In order to promote price stability as Q204: Figure 13.11 Q205: Over the past two decades, whenever changes![]()
![]()
Unlock this Answer For Free Now!
View this answer and more for free by performing one of the following actions

Scan the QR code to install the App and get 2 free unlocks

Unlock quizzes for free by uploading documents