Figure 13.10 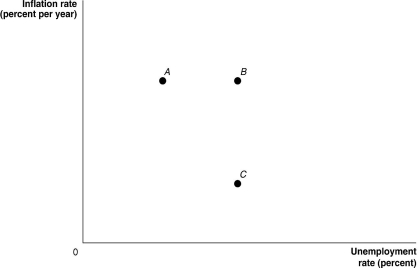 Alt text for Figure 13.10: In figure 13.10, a graph shows the points along which a typical long-run Phillips curve runs.
Long description for Figure 13.10: The x-axis is labelled, unemployment rate percent, and the y-axis is labelled, inflation rate percent per year.3 points; A, B, and C are plotted such that A and B share equivalent y-axis values, and B and C share equivalent x-axis values.
-Refer to Figure 13.10.A typical long-run Phillips curve would have the appearance of a curve running through points
A) A and B.
B) A and C.
C) B and C.
D) A, B, and C.
Correct Answer:
Verified
Q163: According to the "rational expectations" school of
Q173: According to the "rational expectations" school of
Q182: According to _, the economy is normally
Q184: _ would be the source of a
Q186: Models that focus on factors other than
Q189: If rational workers and firms know that
Unlock this Answer For Free Now!
View this answer and more for free by performing one of the following actions

Scan the QR code to install the App and get 2 free unlocks

Unlock quizzes for free by uploading documents