Figure 13.11 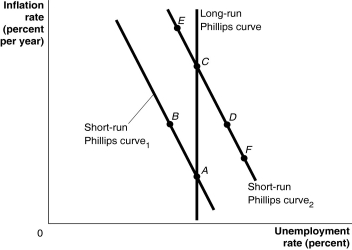 Alt text for Figure 13.11: In figure 13.11, a graph shows the short-run and long-run Phillips curves.
Long description for Figure 13.11: The x-axis is labelled, unemployment rate percent, and the y-axis is labelled, inflation rate percent per year.A straight line labelled, short-run Philips Curve 1, begins at the top left corner and slopes down to the bottom center.A straight line labelled, short-run Philips Curve 2, follows the same slope as Curve 1, but is plotted to the right.A straight line labelled, long-run Philips Curve, is perpendicular to the x-axis, and intersects the short-run Philips Curve 1 at point A near the bottom end of both lines.Point B is plotted half way along the short-run Philips Curve 1.Long-run Philips Curve intersects short-run Philips Curve 2 at point C near the top half of the curves.Point D is plotted more than half way along the short-run Philips Curve 2.Points E and F are plotted close to the left and right ends, respectively, of the short-run Philips Curve 2.
-Refer to Figure 13.11.A(n) ________ would be depicted as a movement from A to D to C.
A) supply shock, such as rising oil prices,
B) increase in aggregate demand
C) implementation of contractionary monetary policy
D) increase in short-run aggregate supply
E) expansionary fiscal policy
Correct Answer:
Verified
Q244: If the Bank of Canada's announcements about
Q245: If the Bank of Canada announces that
Q246: If the Bank of Canada chooses to
Q247: Figure 13.10 Q248: Deflation refers to Q250: In the aftermath of the global recession, Q251: The current approach to monetary policy is Q252: Which of the following would shift the Q253: Expansionary monetary policy will result in Q254: Disinflation refers to![]()
A)a decrease in the rate
A)lower interest
A)a decrease in the price
Unlock this Answer For Free Now!
View this answer and more for free by performing one of the following actions

Scan the QR code to install the App and get 2 free unlocks

Unlock quizzes for free by uploading documents