Figure 15.7 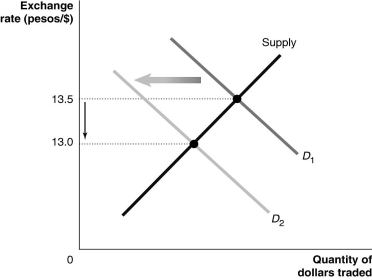 Alt text for Figure 15.7: In figure 15.7, a graph illustrates the quantity of dollars traded against the exchange rate.
Long description for Figure 15.7: The x-axis is labelled, quantity of dollars traded per day.The y-axis is labelled, exchange rate, peso to Canadian dollar, with values 1.00 and 1.05 dollars marked.A straight line supply curve slopes up from the bottom left corner to the top right corner.2 parallel straight line demand curves, D1 and D2 slope down form the top left corner to the bottom right corner.Curve D2 is plotted to the left of curve D1.The change from curve D1 to curve D2 is indicated by a left pointing arrow.Curve S intersects curve D1 at a point with a y-axis value of 13.5.Curve S intersects curve D2 at a point with a y-axis value of 13.00.Both points of intersections are connected to their corresponding y-axis values with dotted lines.The difference between the y-axis values is indicated with a down pointing arrow.
-Refer to Figure 15.7.Which of the following would cause the change depicted in the figure above?
A) Lack of investment in infrastructure causes Mexican productivity to fall relative to Canadian productivity.
B) A possibility of diseased poultry in Mexico causes Canadian consumers to decrease their preferences for Mexican-raised chickens relative to Canadian-raised chickens.
C) A new trade agreement with Mexico results in Canada removing all tariffs on sugar imported from Mexico.
D) An expansionary monetary policy in Mexico causes an increase in the price level of Mexican goods relative to Canadian goods.
E) An increase in the Canadian savings rate relative to the savings rate in Mexico.
Correct Answer:
Verified
Q145: If, at the current exchange rate between
Q146: By 2015, _ members of the European
Q147: Figure 15.6 Q148: Which of the following would decrease the Q149: The "Big Mac Theory of Exchange Rates" Q151: A Big Mac costs $4.07 in Canada Q152: If inflation in Mexico is lower than Q153: If the purchasing power of a Canadian Q154: If the exchange rate between the Canadian Q155: If the purchasing power of the Canadian![]()
Unlock this Answer For Free Now!
View this answer and more for free by performing one of the following actions

Scan the QR code to install the App and get 2 free unlocks

Unlock quizzes for free by uploading documents