This graph of expected sales level and expected output shows: 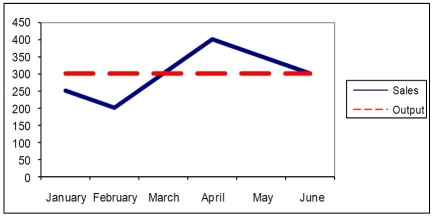
A) a chase production plan is being used.
B) a level production plan is being used.
C) a mixed production plan is being used.
D) planning levels have been computed.
Correct Answer:
Verified
Q3: There are few, if any, options for
Q6: Detailed planning and control is riskier than
Q20: What is the purpose of S&OP and
Q22: Bottom-up planning should be used when the
Q25: Willow Trees Inc. makes seven different products,
Q27: At the beginning of the semester, you
Q28: The alternative production strategies of level, chase,
Q32: Last month a firm made 100 model
Q35: Seventy percent of a house painter's business
Q40: When the products and services have very
Unlock this Answer For Free Now!
View this answer and more for free by performing one of the following actions

Scan the QR code to install the App and get 2 free unlocks

Unlock quizzes for free by uploading documents