Multiple Choice
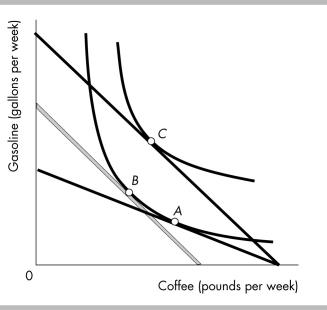
-In the above figure, the rise in the price of a gallon of gasoline that created the movement from point C to point A would be shown as a movement ________ along the demand curve for ________.
A) upward; coffee
B) downward; coffee
C) upward; gasoline
D) downward; gasoline
Correct Answer:
Verified
Related Questions

