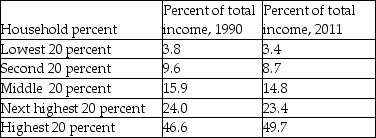
-Using the table provided above to construct Lorenz curves representing 1990 and 2011, what do you discover and how is this interpreted?
A) The Lorenz curve for 1990 is further away from the line of equality than the curve for 2011. This means that inequality is decreasing.
B) The Lorenz curve for 1990 is further away from the line of equality than the curve for 2011. This means that inequality is increasing.
C) The Lorenz curve for 2011 is further away from the line of equality than the curve for 1990. This means that inequality is increasing.
D) The Lorenz curve for 2011 is further away from the line of equality than the curve for 1990. This means that inequality is decreasing.
Correct Answer:
Verified
Q279: Redistribution programs create a disincentive to work
Q280: The inefficiency created by income taxation occurs
Q281: The Lithuanian tax rate for all citizens'
Q282: "If the distribution of income was equal,
Q283: What is the difference between wealth and
Q285: The 2010 U.S. Federal Personal Income six
Q286: According to the 2007/2008 United Nations Human
Q287: Which is distributed more equally: income or
Q288: In the United States, do the poorest
Q289: What is the main reason that the
Unlock this Answer For Free Now!
View this answer and more for free by performing one of the following actions

Scan the QR code to install the App and get 2 free unlocks

Unlock quizzes for free by uploading documents