The graph that shows intrapleural pressure changes during normal spontaneous breathing is depicted by which of the following?
A) 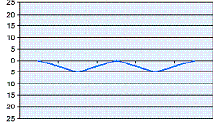
B) 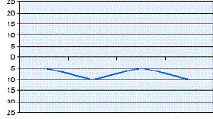
C) 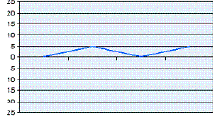
D) 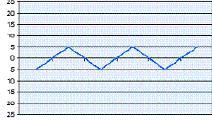
Correct Answer:
Verified
Q7: An increase in peak inspiratory pressure (PIP)without
Q8: The body's mechanism for conducting air in
Q9: Which of the following are involved in
Q9: The formula used for the calculation of
Q10: Calculate airway resistance (Raw )for a ventilator
Q13: Plateau pressure (Pplateau)is measured during which phase
Q14: Calculate the effective static compliance (Cs)given the
Q16: The respiratory therapist should expect which of
Q17: During spontaneous inspiration alveolar pressure (PA)is about:
Q18: The term used to describe the tendency
Unlock this Answer For Free Now!
View this answer and more for free by performing one of the following actions

Scan the QR code to install the App and get 2 free unlocks

Unlock quizzes for free by uploading documents