The Ventilator Graphics Generated by Mechanical Ventilation with Pressure-Controlled Continuous
The ventilator graphics generated by mechanical ventilation with pressure-controlled continuous mandatory ventilation (PC-CMV) ,rate 18,peak inspiratory pressure (PIP) 25 cm H2O,positive-end-expiratory pressure (PEEP) 5 cm H2O,are shown in the scalars below.Interpretation of these scalars reveals which of the following? 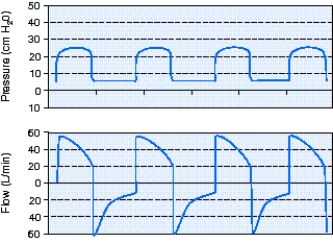
A) The flow rate is set too high and should be reduced.
B) There is air trapping that could be due to a high respiratory rate.
C) The ventilator settings are appropriate and there are no problems.
D) There is a leak in the system that needs to be identified and corrected.
Correct Answer:
Verified
Q1: Identify the improperly set ventilator parameter using
Q3: What is the expiratory time shown in
Q4: What is the inspiratory time shown in
Q5: The respiratory therapist observes the pressure-time scalar
Q7: What is the trigger variable for the
Q8: Identify the sinusoidal (or sine)waveform in the
Q9: The type of flow curve produced by
Q10: Calculate the airway resistance (Raw)using the information
Q11: The respiratory therapist sees the following scalars
Q14: The most important factor to affect the
Unlock this Answer For Free Now!
View this answer and more for free by performing one of the following actions

Scan the QR code to install the App and get 2 free unlocks

Unlock quizzes for free by uploading documents