The change in the single breath carbon dioxide (CO2) curve from "A" to "B" shown in the figure may be as a result of which of the following? 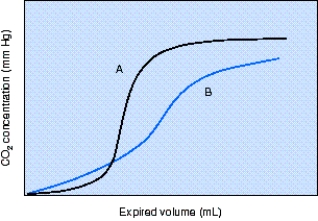
A) Hypervolemia
B) Decreased positive-end-expiratory pressure (PEEP)
C) Increased mean airway pressure
D) Excessive bronchodilator administration
Correct Answer:
Verified
Q4: Pulse oximetry is most useful in which
Q8: A pulse oximeter reading will be most
Q11: During which phase of a capnogram does
Q13: A patient in the intensive care unit
Q16: During shift report,the day shift respiratory therapist
Q18: The capnogram in the figure is indicative
Q19: An arterial blood gas should be done
Q20: The area under the curve of a
Q25: Components of an indirect calorimeter may include
Q40: During calibration of a transcutaneous monitor the
Unlock this Answer For Free Now!
View this answer and more for free by performing one of the following actions

Scan the QR code to install the App and get 2 free unlocks

Unlock quizzes for free by uploading documents