Figure 4-5 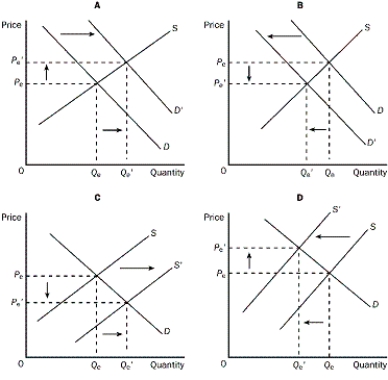
-Refer to Figure 4-5. Graph A shows which of the following?
A) an increase in demand
B) an increase in quantity demanded
C) an increase in supply
D) a decrease in consumer income.
Correct Answer:
Verified
Q45: What would an early frost in the
Q50: Figure 4-5 Q52: Figure 4-5 Q53: Figure 4-5 Q54: Which of the following is NOT one Q57: What do comparative statics involve? Q58: What is step one in the Three-Step Q59: Which of the following would definitely result Q60: Suppose there is an earthquake that destroys Q185: Which of the following will definitely cause Unlock this Answer For Free Now! View this answer and more for free by performing one of the following actions Scan the QR code to install the App and get 2 free unlocks Unlock quizzes for free by uploading documents![]()
![]()
![]()
A)comparisons of varying

