Multiple Choice
Figure 4-5 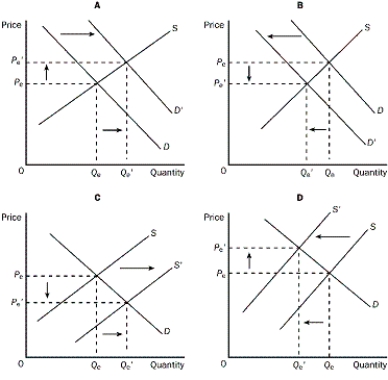
-Refer to Figure 4-5. Which of the four graphs shown illustrates a decrease in quantity demanded?
A) graph A
B) graph B
C) graph C
D) graph D
Correct Answer:
Verified
Related Questions
Q44: Figure 4-5 Q45: What would an early frost in the![]()

