Multiple Choice
Figure 4-7 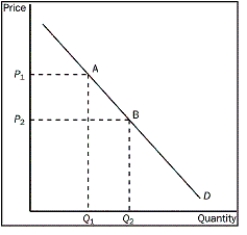
-Refer to Figure 4-7. What does the movement from point A to point B on the graph show?
A) a decrease in demand
B) an increase in demand
C) a decrease in quantity demanded
D) an increase in quantity demanded
Correct Answer:
Verified
Related Questions
Q17: In a perfectly competitive market, buyers and
Q105: What is one reason that government taxes
Q107: If cigarettes and marijuana had been found
Q110: Other things equal, what happens when the
Q111: What does the market supply curve show?
A)
Q241: For teens,what does a 10 percent increase
Unlock this Answer For Free Now!
View this answer and more for free by performing one of the following actions

Scan the QR code to install the App and get 2 free unlocks

Unlock quizzes for free by uploading documents