Multiple Choice
Figure 4-8 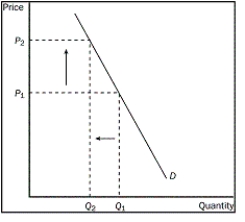
-Refer to Figure 4-9. Which graph could be used to show the result of 5 percent of the country's smokers deciding to stop smoking?
A) a.
B) b.
C) c.
D) Each graph could be used to show the result.
Correct Answer:
Verified
Related Questions
Q101: What will happen if the price of
Q103: What relationship is shown by the supply
Q112: For a seller, which of the following
Q118: What does fewer sellers in the market

