Figure 8-1 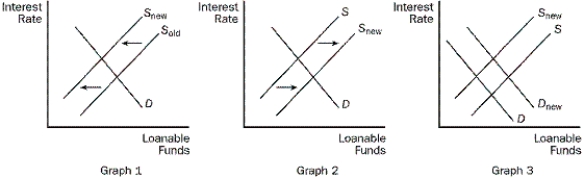
-Refer to Figure 8-1. Which of the graphs in the figure shows the effects of an increase in the tax rate on saving?
A) graph 1
B) graph 2
C) graph 3
D) none of the three graphs
Correct Answer:
Verified
Q2: Index funds are usually outperformed by mutual
Q3: Mutual funds are a type of financial
Q4: Corporations receive no proceeds from the resale
Q23: Public saving is T - G, while
Q29: National saving is equal to Y -
Q168: When a corporation experiences financial problems, bondholders
Q171: The sale of stocks or bonds to
Q180: Generally, if people expect a company to
Q180: Other things the same, the higher the
Q404: If a share of stock in Skylight
Unlock this Answer For Free Now!
View this answer and more for free by performing one of the following actions

Scan the QR code to install the App and get 2 free unlocks

Unlock quizzes for free by uploading documents