Figure 8-1 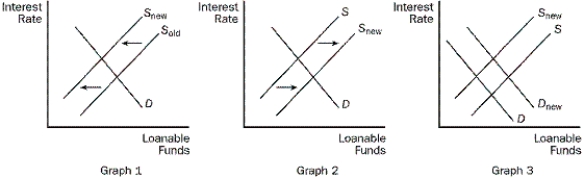
-Refer to Figure 8-1. Which of the graphs in the figure shows the effects of instituting a national sales tax and simultaneously lowering the income tax rate?
A) graph 1
B) graph 2
C) graph 3
D) none of the three graphs
Correct Answer:
Verified
Q19: Lenders sell bonds and borrowers buy them.
Q148: Assuming that other things remain the same,
Q156: In the past few years, the Canadian
Q158: Suppose Parliament instituted an investment tax credit.
Q159: Which of the following best describes the
Q160: When the government runs a budget deficit,
Q162: Which of the following best describes the
Q163: Which of the following best explains why
Q167: When will a change in the tax
Q178: Corporate bonds generally have higher interest rates
Unlock this Answer For Free Now!
View this answer and more for free by performing one of the following actions

Scan the QR code to install the App and get 2 free unlocks

Unlock quizzes for free by uploading documents