Multiple Choice
Figure 1 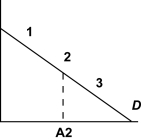
In Figure 1,the point A2 is half way between the origin and the quantity intercept of the demand curve.The price elasticity at point "1" is
A) 0
B) between - and -1
C) -1
D) between -1 and 0
Correct Answer:
Verified
Related Questions
Q6: Suppose there are two goods (X and
Q22: Two goods,X and Y,are called complements if
A)
Q22: An increase in quantity demanded is represented
Q23: Figure 2 Q23: If income doubles and the quantity demanded![]()
Unlock this Answer For Free Now!
View this answer and more for free by performing one of the following actions

Scan the QR code to install the App and get 2 free unlocks

Unlock quizzes for free by uploading documents