Graph 2-13
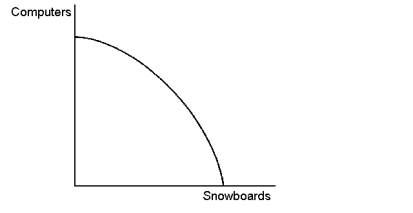
-Refer to Graph 2-13. For the production possibilities frontier illustrated in the graph shown:
a. how would you measure the opportunity cost of obtaining more computers?
b. how does that opportunity cost change as society chooses to produce and consume more computers?
c. why does the opportunity cost change that way?
Correct Answer:
Verified
View Answer
Unlock this answer now
Get Access to more Verified Answers free of charge
Q120: Macroeconomics approaches the study of economics from
Q121: Which of the following statements are positive,
Q123: Identify each of the following topics as
Q124: What is the purpose of models in
Q125: The slope of a line is calculated
Q126: The policy results from economic modelling:
A)focus on
Q126: Suppose an economy produces two products. These
Q127: Draw a production possibilities frontier for the
Q128: Using this outline (Graph 2-10), insert arrows
Q457: Why do economists use graphs?
Unlock this Answer For Free Now!
View this answer and more for free by performing one of the following actions

Scan the QR code to install the App and get 2 free unlocks

Unlock quizzes for free by uploading documents