Multiple Choice
Graph 9-5
This graph refers to the market for oil in Spain.
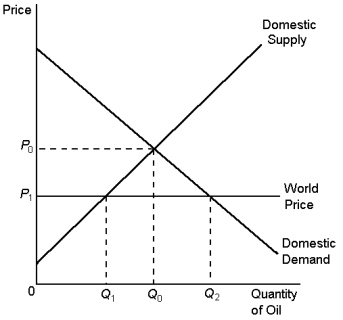
-According to Graph 9-5, the price of oil and the quantity demanded in Spain after trade would be:
A) P1, Q1
B) P1, Q2
C) P1, Q0
D) P0, Q0
Correct Answer:
Verified
Related Questions
Q84: Graph 9-4
This graph refers to the market
Q86: Graph 9-3 Q87: Graph 9-4 Q95: Graph 9-4 Q98: Graph 9-3 Q100: Graph 9-3 Q103: Graph 9-6 Q105: Graph 9-8 Q109: Graph 9-6 Q113: Graph 9-7 Unlock this Answer For Free Now! View this answer and more for free by performing one of the following actions Scan the QR code to install the App and get 2 free unlocks Unlock quizzes for free by uploading documents![]()
This graph refers to the market
This graph refers to the market
![]()
![]()
This graph refers to the market![]()
This graph refers to the market![]()

