Graph 10-1
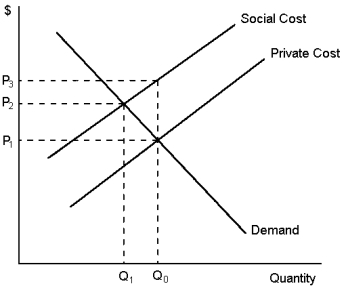
-Refer to Graph 10-1. In the figure shown the marginal:
A) benefit of the positive production externality is measured by P3 - P1
B) cost of the negative production externality is measured by P3 - P2
C) cost of the negative production externality is measured by P3 - P1
D) cost of the negative production externality cannot be measured
Correct Answer:
Verified
Q70: The impact of one person's actions on
Q70: Graph 10-1 Q71: Suppose that large scale pork production has Q74: If a particular market is associated with Q75: Suppose that water pollution creates a negative Q76: Hikers frequently claim that livestock grazing in Q77: An externality will: Q78: At any given quantity, the height of Q78: Suppose people plant flowering trees near their Q80: The height of the supply curve at![]()
A)usually be characterised as a
Unlock this Answer For Free Now!
View this answer and more for free by performing one of the following actions

Scan the QR code to install the App and get 2 free unlocks

Unlock quizzes for free by uploading documents