Graph 10-3
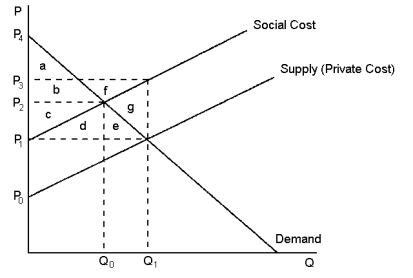 This graph reflects the market for kiwifruit, where pesticide used by kiwifruit orchardists also unintentionally kills honey bees.
-Refer to Graph 10-3. The total surplus derived from the most efficient kiwifruit production levels is represented by the area:
A) g
B) e + g
C) c + d
D) a + b + c
Correct Answer:
Verified
Q81: Internalising a positive production externality will cause
Q86: When a market is in equilibrium and
Q91: Suppose that a steel factory emits a
Q94: When a producer operates in a market
Q98: Which of the following statements about internalising
Q102: Irrespective of whether an externality is positive
Q103: If sparks from trains sets adjacent farmland
Q109: The problems of externalities are often solved
Q110: Encouraging firms to increase production via a
Q111: Internalising a positive production externality through technology
Unlock this Answer For Free Now!
View this answer and more for free by performing one of the following actions

Scan the QR code to install the App and get 2 free unlocks

Unlock quizzes for free by uploading documents