Graph 13-2
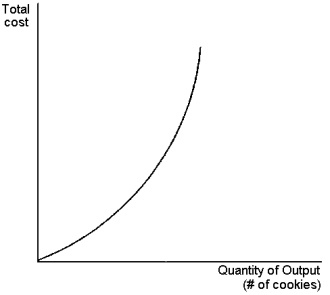 This graph depicts a total cost function for a firm that produces cookies. Use the graph to answer the following question(s) .
-Refer to Graph 13-2. Identify the true statements from the list below. (i) diminishing marginal product for all levels of input usage
(ii) total output increases but at a decreasing rate
(iii) the slope of the production function increases as quantity of inputs increase.
A) (i) only
B) (ii) and (iii)
C) (i) and (iii)
D) (i) , (ii) and (iii)
Correct Answer:
Verified
Q77: Accounting profit is equal to:
A)total revenue minus
Q79: Diminishing marginal product of labour occurs when
Q82: The cost to produce an additional unit
Q83: A firm's total costs divided by the
Unlock this Answer For Free Now!
View this answer and more for free by performing one of the following actions

Scan the QR code to install the App and get 2 free unlocks

Unlock quizzes for free by uploading documents