Graph 13-6
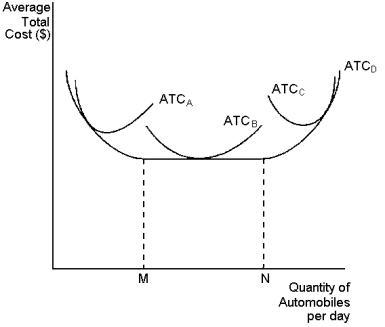 This graph depicts average total cost functions for a firm that produces automobiles. Use the graph to answer the following question(s) .
-Refer to Graph 13-6. Which of the curves is most likely to characterise the short-run average total cost curve of the biggest factory?
A) ATCA
B) ATCB
C) ATCC
D) ATCD
Correct Answer:
Verified
Q128: Graph 13-5 Q137: Graph 13-6 Q137: Graph 13-4 Q139: Economists class the short run as the Q139: At all levels of production beyond the Q141: Table 13-1 Q143: Table 13-1 Q147: Table 13-2 Q158: Specialisation among workers occurs when: Q159: Table 13-1 Unlock this Answer For Free Now! View this answer and more for free by performing one of the following actions Scan the QR code to install the App and get 2 free unlocks Unlock quizzes for free by uploading documents![]()
![]()
![]()
Measures of Cost for Splashy Cardboard
Measures of Cost for Splashy Cardboard
Adrienne's Premium Boxing Service subcontracts with
A)each worker is
Measures of Cost for Splashy Cardboard

