Multiple Choice
Graph 13-6
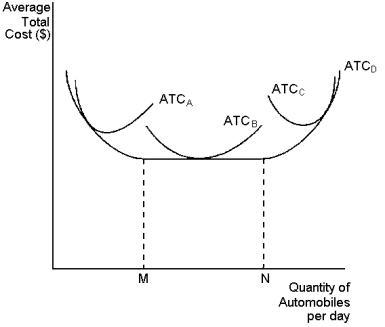 This graph depicts average total cost functions for a firm that produces automobiles. Use the graph to answer the following question(s) .
-Refer to Graph 13-6. This firm experiences economies of scale at which output levels?
A) output levels above N
B) output levels between M and N
C) output levels below M
D) all of the above levels if the firm is operating in the long run
Correct Answer:
Verified
Related Questions

