Graph 13-6
 This graph depicts average total cost functions for a firm that produces automobiles. Use the graph to answer the following question(s) .
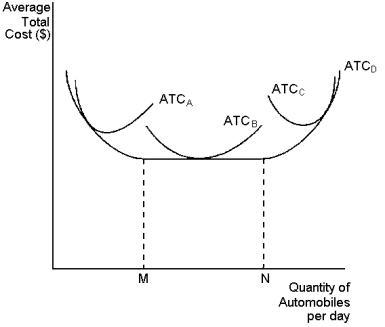
-Refer to Graph 13-6. At levels of output above point N, the firm experiences:
A) economies of scale
B) accounting profit
C) economic profit
D) diseconomies of scale
Correct Answer:
Verified
Q128: Graph 13-5 Q129: The long-run average total cost curve is: Q131: Graph 13-5 Q133: Graph 13-5 Q137: Graph 13-4 Q139: At all levels of production beyond the Q139: Economists class the short run as the Unlock this Answer For Free Now! View this answer and more for free by performing one of the following actions Scan the QR code to install the App and get 2 free unlocks Unlock quizzes for free by uploading documents![]()
A)flatter![]()
![]()
![]()

