Graph 14-5
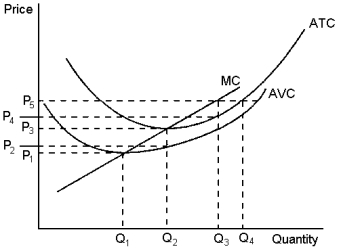
The graph depicts the cost structure of a firm in a competitive market. Use the graph to answer the following question(s) .
-Refer to Graph 14-5. When market price is P5, a profit-maximising firm's profits can be represented by the area:
A) (P5 - P4) * Q3
B) P5 * Q3
C) (P5 - P3) * Q2
D) when market price is P5 there are no profits
Correct Answer:
Verified
Q84: Graph 14-4 Q100: Graph 14-3 Q101: If a business ignores some of its Q106: Profit-maximising firms enter a competitive market when: Q108: A production cost that has already been Q109: Which of the following statements best reflects Q113: Suppose a profit-maximising firm in a competitive Q117: A profit-maximising firm in a competitive market Q119: The Wheeler Wheat Farm has a long-term Q120: When profit-maximising firms in competitive markets are![]()
![]()
A)total
Unlock this Answer For Free Now!
View this answer and more for free by performing one of the following actions

Scan the QR code to install the App and get 2 free unlocks

Unlock quizzes for free by uploading documents