Graph 14-6
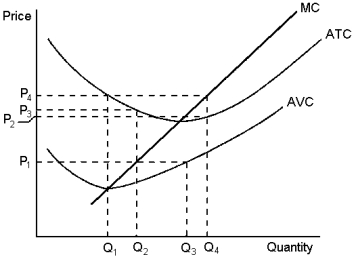
This graph depicts the cost structure of a firm in a competitive market. Use the graph to answer the following question(s) .
-Refer to Graph 14-6. When market price is P1, a profit-maximising firm's total profit or loss can be represented by which area?
A) (P3 - P1) * Q2; loss
B) P1 * Q3; profit
C) ( P2 - P1) * Q1; loss
D) we can't determine it because we don't know the fixed costs
Correct Answer:
Verified
Q93: Graph 14-4 Q102: A profit-maximising firm's short-run shut down criterion Q107: A profit-maximising firm that is showing losses Q120: Graph 14-5 Q123: Which of the following statements are most Unlock this Answer For Free Now! View this answer and more for free by performing one of the following actions Scan the QR code to install the App and get 2 free unlocks Unlock quizzes for free by uploading documents![]()
![]()

