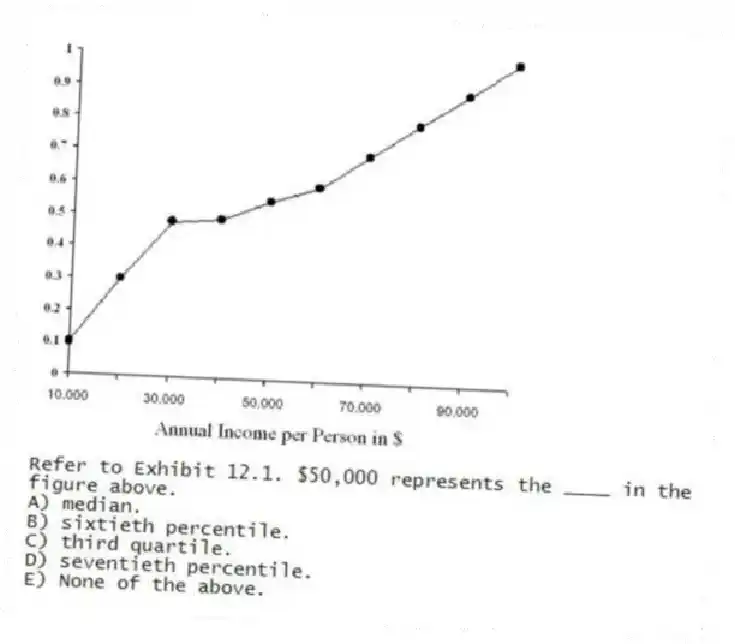
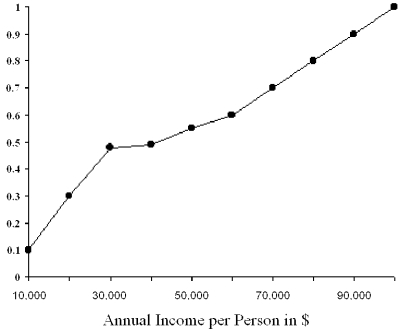
-Refer to Exhibit 12.1. $50,000 represents the ____ in the figure above.
A) median.
B) sixtieth percentile.
C) third quartile.
D) seventieth percentile.
E) None of the above.
Correct Answer:
Verified
Q8: An observation that is very different in
Q8: Data analysis hinges on which of the
Q8: An observation that is very different in
Q9: Q12: Use the information below to answer the Q15: A researcher had calculated the sample chi-square Q16: A clothing manufacturer traditionally makes sweatshirts from Q17: Use the information below to answer the Q18: A researcher is interested in analyzing a Q28: A researcher calculates a chi-square test statistic![]()
Unlock this Answer For Free Now!
View this answer and more for free by performing one of the following actions

Scan the QR code to install the App and get 2 free unlocks

Unlock quizzes for free by uploading documents