Consider the following chart.Which of the following statements is most correct? 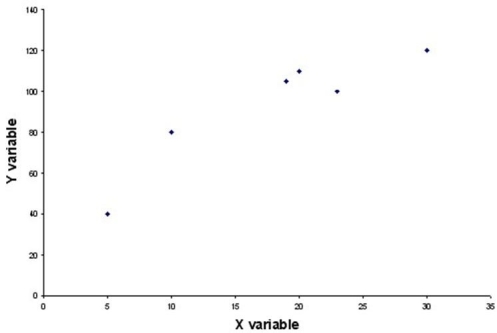
A) The values for the dependent variable are determined by the values for the independent variable.
B) The values in a scatter plot should be connected by a straight line.
C) The variable on the horizontal axis should be the independent variable.
D) A scatter plot like this one shows the trend in the data over time.
Correct Answer:
Verified
Q107: Which of the following is a key
Q119: The Carter Department Store has data on
Q121: Assuming you have data for a variable
Q121: In constructing a scatter diagram:
A) the independent
Q124: A scatter diagram can be used to
Q125: Explain what information can be conveyed by
Q126: Why should a histogram contain no gaps
Q128: The Fitness Center manager has collected data
Q130: In creating a frequency distribution for numerical
Q136: Explain why it is appropriate to connect
Unlock this Answer For Free Now!
View this answer and more for free by performing one of the following actions

Scan the QR code to install the App and get 2 free unlocks

Unlock quizzes for free by uploading documents