Three scatter diagrams are given below.How many of the diagrams present data that can be described by a linear relationship and,therefore,justifiably summarized by the correlation coefficient?
Plot A 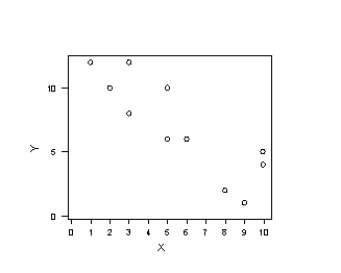
Plot B 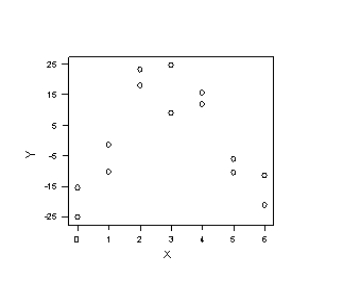
Plot C 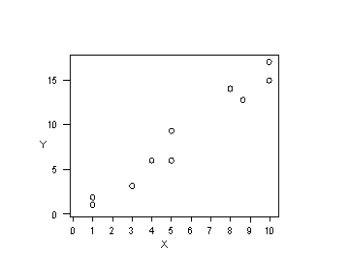
A) Plot A
B) Plot B
C) Plot A and Plot B
D) Plot A and Plot C
Correct Answer:
Verified
Q66: In a factorial experiment,each combination of different
Q69: In a designed experiment,a(n)_ measures the difference
Q70: An experiment that evaluates the effect of
Q71: In regression analysis,_ measures the proportion of
Q73: In Excel's Histogram tool,how are bins defined?
Q75: The times (in minutes) required by a
Q77: A manager was assigned the task of
Q78: _ is a methodology for drawing conclusions
Q79: State the steps involved in a hypothesis
Q80: Suppose that a scatter diagram depicts a
Unlock this Answer For Free Now!
View this answer and more for free by performing one of the following actions

Scan the QR code to install the App and get 2 free unlocks

Unlock quizzes for free by uploading documents